

"Near transit" is the weakest thing a listing can say. A stop 200 meters away served four times a day is not the amenity a renter is picturing. The data to say something truer (which stops, how often, and how far you can actually get from here) exists for the whole country, and it changes every week.
Solutions
For real estate and proptech
Transit quality as a property attribute, computed the same way in every market and kept current.
Trusted by
What we help with
Transit scores that mean something
Stops within a walk of each address, weighted by how often they run and by which modes serve them, rather than by whether a dot appears on a map.
Commute-time search
Let someone search by "45 minutes from this office" instead of by radius. Isochrones draw the area; travel-time matrixes rank a whole inventory against a set of destinations.
Portfolio and market analysis
Compare assets across metros on the same basis, and use ten years of archived feed versions to show how service at a location has changed rather than asserting that it has.
Something to show the buyer
The named routes and operators that actually serve an address, and how often, so a listing can say which lines rather than that transit exists.
What it runs on
Transitland Datasets
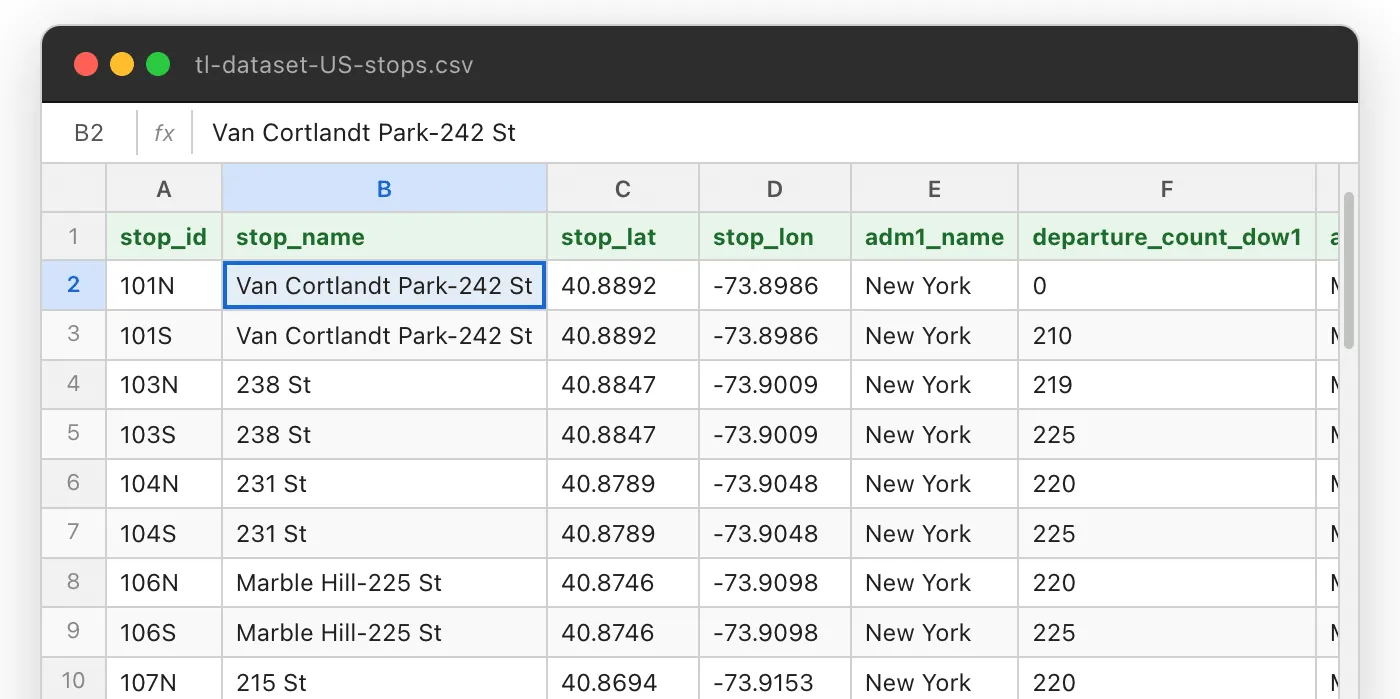
Nationwide stop and route tables with per-stop departure counts by day of week, deduplicated across agencies, in CSV and GeoJSONL: bulk input for scoring an inventory.
Interline Routing Platform
Walk, bike and drive routing worldwide, transit itineraries across the United States, and matrixes sized for a whole portfolio rather than one address at a time.
Transitland APIs
Scheduled and live departures for a stop, for anything that has to say what is leaving in the next ten minutes.
How the method works
Customer work is under wrap, but the pieces are the same ones in these:
- Scoring 1,600 sites by the transit near them . A spatial join against a public list of locations, tiered by departures within walking distance and within three miles. Swap the locations for an inventory and it is the same analysis.
- GeoJSONL extracts . Why the bulk format is newline-delimited, and how that keeps a nationwide join inside memory.
Scoring an inventory, or building a search?
Tell us the markets and roughly how many addresses, and we will size it.