





Every agency can see its own timetable. Almost nobody can see how it meets the one across the platform, how long a real journey takes across three operators, or how many people live where none of it reaches. Those are analysis problems, and they run on the same continuously updated data as everything else we build.
Solutions
For planning and analysis
Measure what the network actually reaches: the connections riders can make, the trips they can complete, and who is left out.
Trusted by
What we help with
Score every transfer in a region
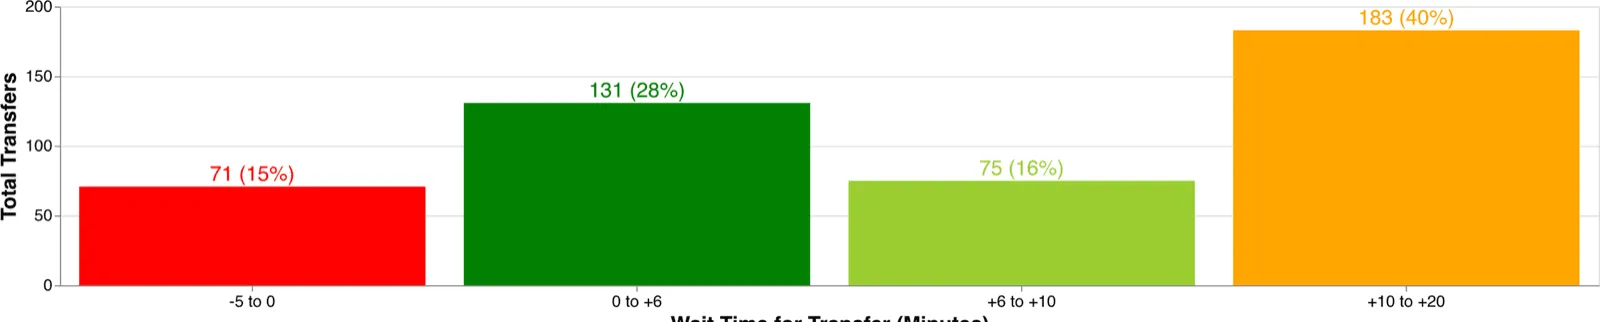
A two-minute misalignment between two timetables can mean a thirty-minute wait. Transfer Analyst scores every transfer at every shared hub from the published GTFS of every operator in the region, so the near-misses are a list rather than a suspicion.
Origin–destination analysis at scale
Travel time and distance between thousands or millions of origin and destination pairs known in advance, across modes and at the times of day that matter. That is a different job from serving an app, and we run it as one.
Accessibility and equity studies
What each population can reach within a travel-time band, compared across modes and across scenarios. Isochrones for the catchment, matrixes for the comparison, and archived feed versions when the question is what changed.
Coverage and gaps
Where service reaches, where it does not, and how many people live in the difference, including the demand-response and deviated-route services that a stop-based analysis misses.
What it runs on
Interline Transfer Analyst
Automated transfer scoring for any region in North America, in place of a spreadsheet comparison of one timetable against another.
Interline Routing Platform
Transit itineraries and street routing behind one API, sized for batch origin–destination work rather than one query at a time.
Transitland Datasets
Stops, routes and service frequency as CSV and GeoJSONL, with derived columns: the input for a join against census geographies or your own study area.
Transitland Feed Archive
Ten years of archived GTFS, so a before-and-after is measured against what was actually published rather than reconstructed.
How the analysis works
Some of this work is public. These show the methods and the data behind them:
- Stop observations from real-time data . Monthly datasets of what actually served each stop, derived from a region's GTFS Realtime, which is a different question from what the timetable promised.
- Scoring 1,600 sites by the transit near them . A spatial join against a public list of locations, tiered by departures within walking distance and within three miles.
- How current is that schedule? . How far into the future feeds actually publish, measured across the archive, which bounds what any forward-looking analysis can claim.
Our applied research carries the longer write-ups, including work with a university lab and a state DOT.
Have a study to run?
Describe the region and the question, and we will tell you which part is a product and which is an engagement.